Fly Tipping Analysis: London and England
Fly tipping analysis for London and England in 2020
What is fly tipping?
Fly-tipping is the illegal dumping of waste on land or in water, and it is a serious issue for our local areas and the environment. We used our back-end data to analyse the boroughs of London and other regions of England. Here are some interesting statistics about fly-tipping in England and London.
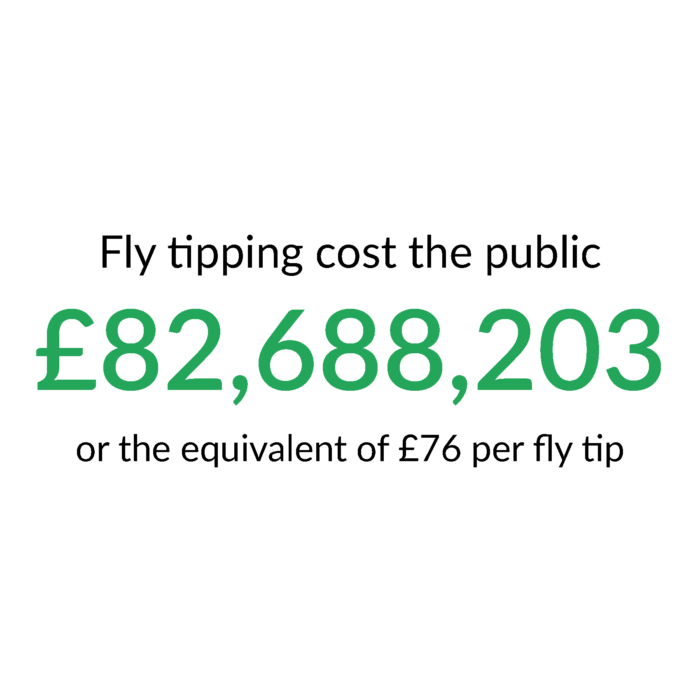
According to Defra, almost 1 million (976,000) fly-tipping incidents were reported by councils in England in 2020. A figure which btw excludes waste fly-tipped on private property because that falls outside the councils’ responsibility. So, whatever you read after this point, don’t forget that the problem is much worse!
Of those million or so fly-tips in England, about one third took place in London. This is equivalent to 1,000 occurring in London every day of the year.
This blog looks at whether this figure is worse or better than the rest of the country, how fly-tipping differs by borough, and whether the price a council charges its residents for bulky waste collection impacts behaviours.
Comparing analysis of apples with apples
Since fly-tipped waste is mainly comprised of stuff thrown out – like a sofa or mattress or items generated from improving the home, like some builders rubble or an old toilet, it seems sensible when comparing regional differences that we adjust the figures to reflect the number of underlying households.
So we took annual fly-tipping incidents by region and London borough and divided them by the latest ONS data for the number of households (which is a bit out of date but not by much) in that region. This analysis creates a ‘fly-tip per 100 homes’ rate – so we can start to compare apples with apples.
region | fly tips | households (000s) | fly tips per 100 households |
London | 360,080 | 3,380 | 11 |
North East | 60,531 | 1,169 | 5 |
Yorkshire | 91,481 | 2,368 | 4 |
North West | 115,192 | 3,116 | 4 |
East Midlands | 75,081 | 2,009 | 4 |
West Midlands | 70,830 | 2,421 | 3 |
South East | 90,507 | 3,801 | 2 |
East | 61,423 | 2,574 | 2 |
South West | 50,506 | 2,438 | 2 |
__ | |||
England | 975,631 | 23,274 | 4 |
England excl. London | 615,551 | 19,894 | 3 |
1 fly tip per 10 London homes
London has an average statistic of 11 fly-tips annually per 100 homes, compared to a national average of 3. Therefore, the challenge in London is over 300% worse than in the rest of the country.
Fun fact – since London has more than one fly-tipping incident per year for every 10 London homes and assuming you (dear reader) are not a fly-tipper, on average, one in nine of your neighbours is a fly-tipper!
Map of rates in England by region in 2020
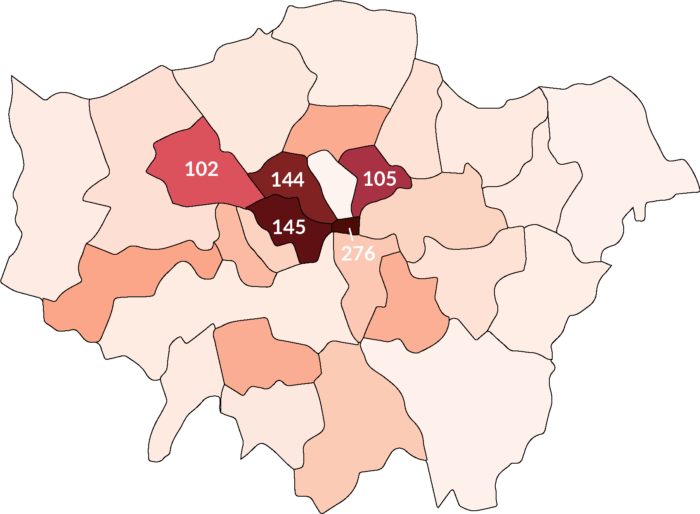
London rates vary significantly borough by borough
Digging into the analysis, Islington, Bromley, Barnet, Kingston and Bexley are the boroughs with the lowest fly-tipping rates per household. Conversely, Brent, Camden, Haringey, Hounslow and Redbridge are the London boroughs with the highest fly-tipping rates and between them accounted for more than a third of all fly-tipping in London in 2020.
Table of London fly tipping
Local authority | fly tips | households | fly tips per 100 homes | council bulky collection charge1 |
Brent | 34,197 | 101,500 | 34 | £35 |
Camden | 34,465 | 111,400 | 31 | £25 |
Haringey | 22,972 | 107,700 | 21 | £20 |
Hounslow | 22,480 | 106,300 | 21 | £40 |
Redbridge | 19,897 | 105,000 | 19 | Free |
Hammersmith & Fulham | 13,322 | 74,700 | 18 | £27 |
Croydon | 25,532 | 146,300 | 17 | £31 |
Merton | 13,047 | 81,500 | 16 | £31 |
Southwark | 17,872 | 128,600 | 14 | £25 |
Westminster | 15,283 | 117,100 | 13 | £31 |
Harrow | 11,151 | 85,600 | 13 | £42 |
Hackney | 12,190 | 103,400 | 12 | £15 |
Ealing | 13,115 | 124,100 | 11 | £40 |
Greenwich | 11,795 | 114,800 | 10 | £11 |
Newham | 11,145 | 117,300 | 10 | £20 |
Hillingdon | 10,434 | 112,400 | 9 | £25 |
Waltham Forest | 9,260 | 100,800 | 9 | Free |
Kensington & Chelsea | 6,490 | 72,400 | 9 | £33 |
Tower Hamlets | 7,365 | 121,200 | 6 | Free |
Lambeth | 6,638 | 122,100 | 5 | £17 |
Barking & Dagenham | 3,794 | 71,800 | 5 | £10 |
Sutton | 3,823 | 78,000 | 5 | £31 |
Enfield | 4,979 | 125,200 | 4 | £40 |
Wandsworth | 4,745 | 129,000 | 4 | £20 |
Richmond upon Thames | 2,887 | 78,500 | 4 | £62 |
Havering | 3,380 | 102,700 | 3 | £43 |
Lewisham | 3,842 | 119,800 | 3 | £20 |
Bexley | 2,552 | 101,600 | 3 | £37 |
Kingston | 1,619 | 65,900 | 2 | £36 |
Barnet | 3,420 | 144,900 | 2 | £35 |
Bromley | 2,821 | 136,900 | 2 | £28 |
Islington | 1,764 | 108,800 | 2 | £30 |
average | 11 | £30 |
Council bulky waste collection charges do not seem to affect fly tipping
It’s often said that a very cheap or free bulky waste collection service from the council will reduce fly-tipping. However, when we compare rates per household with the amount each council charges householders for their bulky waste collection service – we found no statistically relevant correlation between the two.
Of the five councils with the worst levels of fly-tipping, 4 charged less than the London average of £30 for a collection. In fact, despite having one of the highest rates, Redbridge offers the service for free. Equally, 4 have a bulky waste collection charge higher than London’s average of the five councils with the lowest fly-tipping rates.
Table: By region relative to prosecution, skip prices & council bulky waste collection fees
region | fly tips1 | population | fly tips per 1000 people | fined2 | council bulky collection charge3 | skip hire price4 |
London | 360,080 | 8,961,989 | 40 | 2.53% | £27 | £290 |
North East | 60,531 | 2,669,941 | 23 | 0.39% | £19 | £280 |
Yorkshire | 91,481 | 5,502,967 | 17 | 0.46% | £27 | £285 |
North West | 115,192 | 7,341,196 | 16 | 0.49% | £20 | £275 |
East Midlands | 75,081 | 4,835,928 | 15 | 0.63% | £21 | £280 |
West Midlands | 70,830 | 5,934,037 | 12 | 0.35% | £26 | £270 |
South East | 90,507 | 9,180,135 | 10 | 0.86% | £35 | £300 |
East | 61,423 | 6,236,072 | 10 | 1.84% | £33 | £290 |
South West | 50,506 | 5,624,696 | 9 | 0.88% | £30 | £350 |
___ | ||||||
England | 975,631 | 56,286,961 | 17 | 1.0% | £28 | £290 |
England excl London | 615,551 | 47,324,972 | 13 | 0.7% | £28 | £290 |
Notes | ||||||
1 Department for Environment Food & Rural Affairs, Flytipping statistics for England 2019/20 (24 Feb 2021) | ||||||
2 % of reported fly tipping incidents that resulted in a fine – source: Defra | ||||||
3 average fee charged to householders by the council in this region to remove a sofa | ||||||
4 average price including VAT to hire builders skip – source: LoveJunk research |
Conclusion of our fly tipping analysis in England
Instead of encouraging councils to reduce bulky waste collection service fees, perhaps it would be better to concentrate on what boroughs like Islington, Bromley and Barnet are doing to achieve such low rates, then look to apply these lessons elsewhere in the country.
Other posts that might be of interest:
- UK landfill site map
- Ultimate Bulky waste collection guide
- Council bulky waste collection charges England
- Council bulky waste collection services London
Interactive Map UK Fly tipping
source LoveJunk / Defra (2021)