
LoveJunk Fly Tipping Report 2024
Download the Full Report
This page is a summary of the full 'LoveJunk Fly Tipping Report 2024', an in-depth analysis of Defra's 2023 fly tipping statistics for England and also council bulky waste collection services for residents.
The report includes regional comparison of fly tipping rates, criminal prosecution levels, fixed penalty fines issuance and payment, local authority estimated total cost of clear up and policing, and scope and charge of each council's residential bulky waste collection service.
Fly Tipping Rates Unchanged
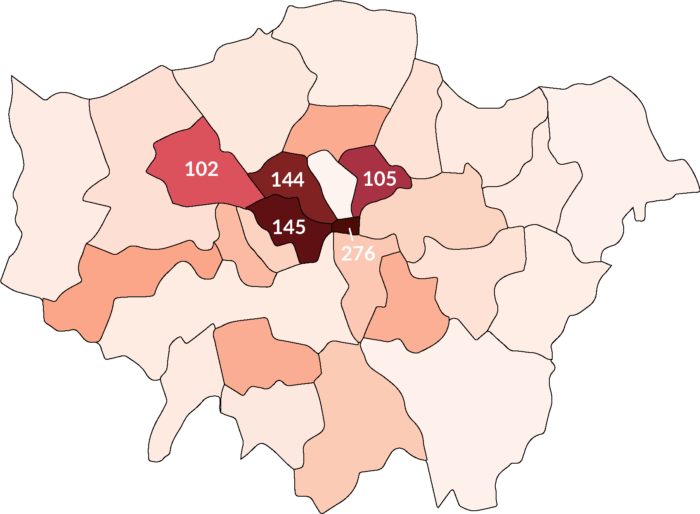
In 2023 there were 1,082,673 fly tipping incidents in England. Very similar to the 2022 figure of 1,091,019. The national average rate of fly tipping was 19 incidents for every 1000 residents.
Councils with the highest rates of fly tipping were the City of London (276), Westminster (145), Camden (144), Hackney (105) and Brent (102). These were all London councils. Councils with the lowest rates were Scilly Isles (0), Oadby and Wigston (0), Amber Valley (1), Ryedale (2) and Craven (2).
1 in 500 Prosecution Rate
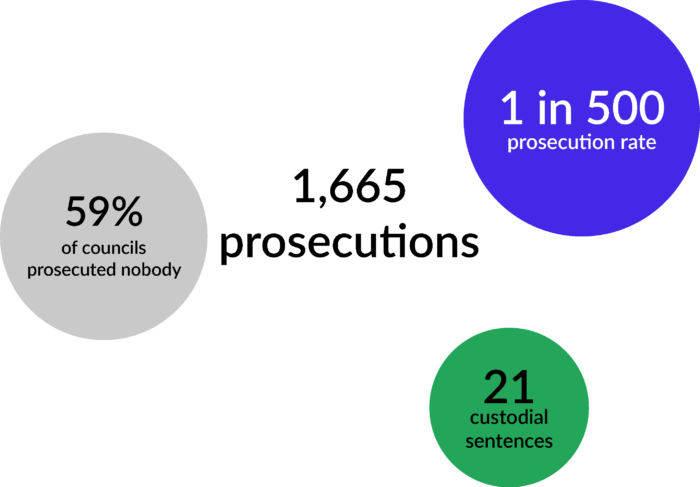
1,665 fly tipping incidents were prosecuted by the police. An average prosecution rate per fly tip of 0.2%% or 1 in 500.
181 (59% of) councils did not prosecute anyone for fly tipping, despite suffering 502,708 fly tips between them.
Of the prosecutions undertaken, only 1% of offenders received a custodial sentence.
87% of Fines are Never Paid
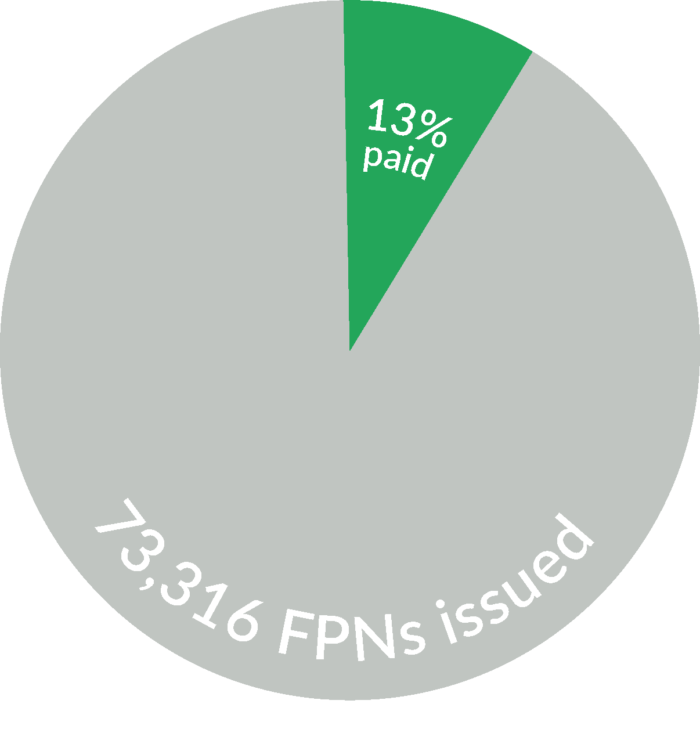
Local authorities issued 73,316 fixed penalty notices relating to fly tipping. This was an issue rate of 7% of all fly tipping incidents.
14% of councils did not issue any FPNs for fly tipping, despite suffering 44, 291 fly tips between them.
Of FPNs issued, only 13% were paid. This means less than 1% of all fly tipping incidents resulted in a local authority fine that was paid.
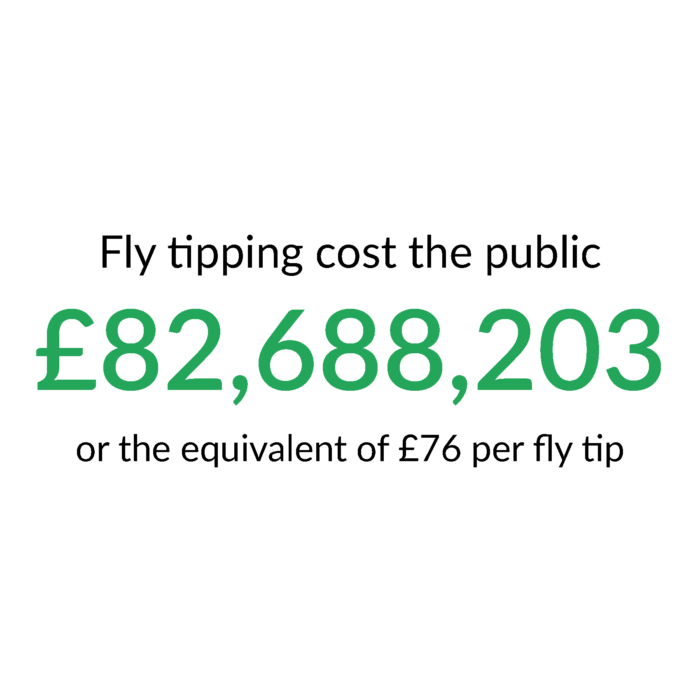
£83 million Cost to the Public
Local authorities spent an estimated £64 million clearing up fly tipped waste from public places - an average of £59 per incident.
In addition, they spent £19 million on actions to catch and punish fly tippers. That is an average cost of £17 per incident.
Accordingly, the total cost of fly tipping (ie. clear up plus investigation and punishment) to the public in 2023 was £83 million. This is equivalent to £76 for every fly tipping incident.
Council Service Unimportant
Scope and cost of a council’s bulky waste collection service for residents is often suggested as a contributor to fly tipping.
95% of councils do not collect DIY waste as part of their bulky service. The average charge to residents is £33, and ranges from £0 to £75.
Fly tip rates of councils offering free collection and/ or DIY waste collection were not materially lower than other councils.